
ep. 24. What are immersive analytics?
7 min read

In today’s episode, we explore immersive analytics: the study of how new interaction and display technologies can be used to support people’s analytical reasoning and decision making abilities. This field is particularly interesting because it sits at the intersection of embodied cognition, immersive technology, and big data, making it relevant to both how we can design to extend human cognition, and to applications at the intersection of extended reality (XR) and generative AI.
We’ll look at where immersive analytics came from, where it's going, and offer three takeaways for displaying and interacting with complex data in ways that can enhance user reasoning and decision making.
A brief history
To better understand immersive analytics, we go back to its roots in data analysis. In the 1960s and 1970s, the process of modeling and exploring data - aka data analysis - started to grow and mature. The goals of data analysis were to help people discover useful information and support decision making, for example, by applying statistical procedures. Data analysis grew, as did new ways to visualize data.
In the 1980s, scientific visualization expanded, focusing on visual display and realistic renderings of spatial data associated with scientific processes, such as 3D phenomena in biology and medicine. In the 1990s, information visualization grew, focusing on visual representations of abstract data, both numerical and non-numerical (e.g., text, geographical information).
As the volume of data across many fields started to substantially increase, in parallel with improvements in graphical user interfaces, visual data mining was born. In visual data mining, people use visual exploration of data to discover understandable patterns. This interaction with visual interfaces to facilitate analytical reasoning grew into the field of visual analytics. Analytical reasoning is defined here as computer-aided knowledge generation.
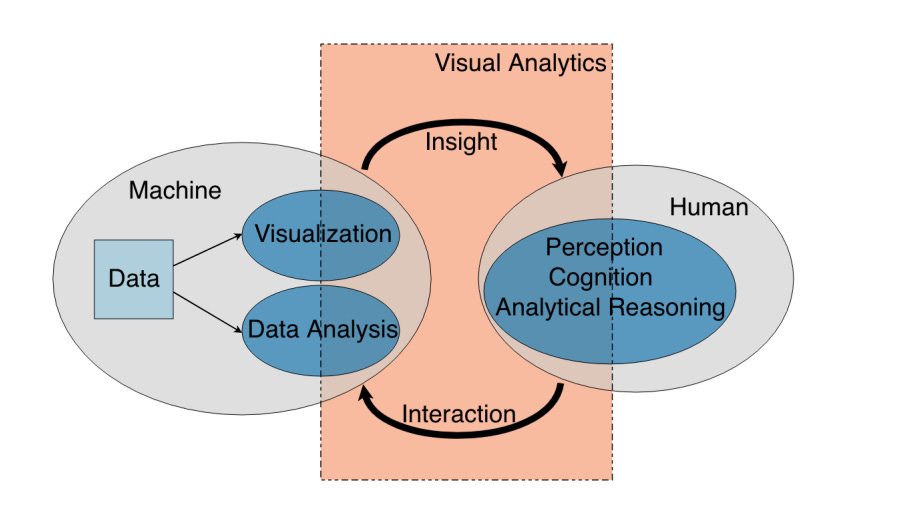
Looking at examples of current visual analytics tools (e.g., Tableau, Microsoft Power BI), we still often see the use of “traditional” user interfaces and interaction paradigms (e.g., windows, icons, menus, pointers on flat, 2D screens). These tools, while powerful, have a steep learning curve and can limit how we engage with data. How might we make interacting with data more intuitive and embodied, to improve users’ data understanding and decision making? Enter immersive analytics.
Immersive analytics today and beyond
Immersive analytics is the science of analytical reasoning and decision-making facilitated by immersive human-computer interfaces. In particular, multisensory interfaces that support collaboration and allow users to immerse themselves in their data can help enhance these reasoning and decision-making capacities. Examples of existing technologies that meet this brief include large touch surfaces, virtual (VR) and mixed reality (MR) environments, and haptic and audio displays.
We’ve seen numerous examples of how more embodied interactions (e.g., using MR and VR) can improve analytical reasoning and decision-making, while facilitating more intuitive, natural interactions with data (example 1, 2, 3, 4, 5 of many!). One example of an immersive analytics application is “space to think”, an immersive layout that allows people to physically navigate digital space, facilitating better information access, recall, and knowledge synthesis.
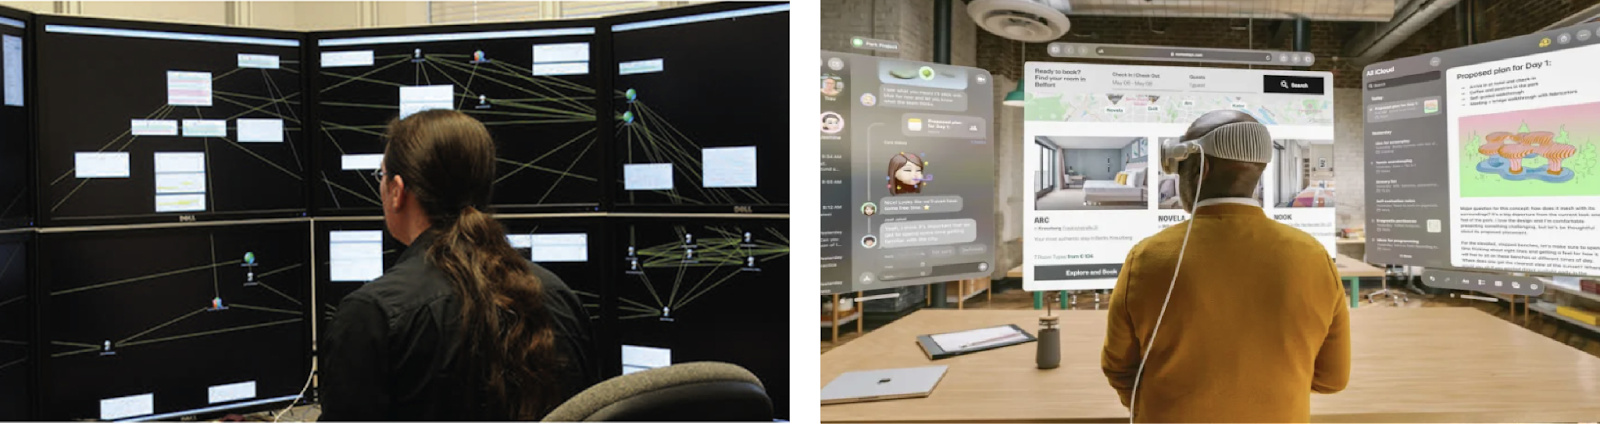
In 2D, this might look like large, high-resolution displays spatially surrounding the user. Using physical movement to navigate around a visualization, users can take advantage of their spatial memory and embodied cognition to maintain references to information in the visualization. This display arrangement can also help facilitate cognitive offloading, freeing up more bandwidth for data interpretation. If you’ve ever arranged two (or more!) large, high-resolution displays around your desk for data analysis or synthesis, these findings might feel familiar to you.
In a MR environment (e.g., Apple Vision Pro), “space to think” might look like extending your existing desktop to a spatial computing environment. I hypothesize that the same cognitive benefit we see in 2D would be enhanced in this high-resolution, embodied environment. I also posit that this helps explain consumer interest in using the Apple Vision Pro to spatially extend your screen space for enhanced productivity.
The future of immersive analytics is likely to expand our use of immersive technologies for data visualization, leveraging natural interactions (e.g., touch, voice) to help users more intuitively engage with data. As the XR and AI connection continues to deepen, we’re also likely to see an increased use of machine learning for personalized data exploration experiences, and greater emphasis on collaborative analytics in immersive environments.
Finally, we should not dismiss the potential for hybrid solutions where users can switch between 2D and 3D modes on desktop monitors and in immersive headsets, respectively, leveraging the strengths of each medium (e.g., precision of 2D interfaces, versus embodied engagement with data that you’ve spatially arranged around your physical environment to identify new connections). There’s evidence that this ability to toggle between these modes can reduce mental effort and create a pleasant user experience.
Three takeaways
As we’re faced with more data than ever, we need to consider how we can effectively harness immersive technologies to help make data analyzable and actionable. If you’re considering how to design immersive displays and interactions to enhance analytical reasoning and decision-making, here are three takeaways to get started:
1. Leverage spatial representations for complex data: Spatial representations can enhance our ability to understand complex relationships and patterns. By utilizing immersive technologies like MR and VR, data visualization becomes an embodied experience, where users can manipulate and explore data in a way that feels more natural and intuitive. This approach can help improve how we make sense of complex datasets, and help make decisions based on those outcomes.
2. Foster collaborative data exploration: A shared space for data exploration can lead to more diverse perspectives, fostering a deeper understanding and innovative solutions to complex problems. Consider building for multi-user environments where teams have the capability to work together within the same virtual space, regardless of their physical location.
3. Integrate multisensory feedback to enrich interaction: Beyond visual data representation, consider how you can incorporate spatial audio and haptic feedback to create a more embodied analysis environment. Multisensory feedback can aid in data exploration by providing intuitive cues and reinforcing insights, making the analytics process more natural and less reliant on abstract interpretation.
Human-Computer Interaction News
Americans’ use of ChatGPT is ticking up, but few trust its election information: A Pew Research Center survey reveals that while ChatGPT usage among American adults has increased from 18% to 23% since July 2023, trust in its election information remains low. Only 2% express significant trust in ChatGPT for election-related content, with about 40% displaying little to no trust. The survey also notes differences in usage based on age and education, with younger people and those with more education being more likely to use ChatGPT.
Durably reducing conspiracy beliefs through dialogues with AI: Researchers from MIT and Cornell explored reducing conspiracy beliefs through dialogues with generative AI. 2,190 conspiracy theory believers engaged in personalized debates with GPT-4 Turbo. Researchers found a ~20% decrease in belief in conspiracy theories after the dialogues. This reduction was durable, not diminishing over two months, and was observed across a range of conspiracy theories, even for those deeply entrenched in the participants' identities. The intervention also reduced belief in unrelated conspiracies, suggesting a general decrease in conspiratorial worldview.
Ready or not, AI is coming to science education — and students have opinions: This Nature article discusses the integration of generative AI into science education and student opinions on its use. While some educational institutions have imposed bans on AI tools due to concerns over plagiarism and misinformation, students argue for the potential educational benefits of AI. They highlight AI's capacity for personalized learning, accessibility enhancements, and instant feedback. However, concerns remain regarding AI's accuracy, the need for responsible usage to avoid over-reliance, and ensuring equitable access to AI tools among students.
Exploring immersive ways for people to interact with data? Sendfull can help you discover and evaluate those interactions. Reach out at hello@sendfull.com
That’s a wrap 🌯 . More human-computer interaction news from Sendfull next week.